433 MHz RF module with Arduino Tutorial 2

There are 4 parts to this tutorial:
- Part 1: Testing the 433 MHz RF transmitter and receiver
- Part 2: Receive and interpret code from an RF remote - ** you are here **
- Part 3: Transmit a known 433 Mhz RF code to a 433 Mhz RF device
- Part 4: Record and play back a 433 Mhz RF remote signal
Project 2: RF Remote Copy
In the previous project, we transmitted a signal wirelessly from one Arduino to another. It was there to help troubleshoot communication between the modules.
It was important to start with a very short distance (1-2 cm) and then move the RF modules further apart to test the range.
The range can be extended by soldering an antenna to the module, or by experimenting with different voltage supplies to the modules (making sure to keep within the voltage limits of the modules.)
In this project - we aim to receive a signal from an RF remote. The remote that I am using is a Mercator Remote Controller for a Fan/Light. (Remote controller code is FRM94). It is important that you use a remote that transmits at the same frequency as your receiver. In this case, my remote just happens to use a frequency of 433MHz. I was able to receive RF signals from from a distance of about 30cm without an antenna (from my remote to the receiver).
In this project - we aim to receive a signal from an RF remote. The remote that I am using is a Mercator Remote Controller for a Fan/Light. (Remote controller code is FRM94). It is important that you use a remote that transmits at the same frequency as your receiver. In this case, my remote just happens to use a frequency of 433MHz. I was able to receive RF signals from from a distance of about 30cm without an antenna (from my remote to the receiver).
Video
Here are the parts that you will need to carry out this project:
Parts Required
- 1 x Arduino UNO or compatible board
- Breadboard
- Wires
- Mercator FRM94 Remote Controller for Fan/Light (Transmitter Model: TR107A)
- RF Module (433 Mhz) - Receiver
Remote Controller
You can quickly test your remote, by pressing one of the buttons in close proximity to the RF receiver (using the same sketch as in Project 1), and you should see the LED flicker on an off in response to the button press. If you don't see the LED flickering, then this project will not work for you.
Here is a picture of the remote controller that I am using:

|

|
Arduino Sketch - Remote Receiver
The following sketch will make the Arduino wait until a signal is detected from the remote (or other 433 MHz RF device). Once triggered, it will turn the LED ON, and start to collect and store the signal data into an array.
I did my best to keep the signal reading section of the sketch free from other functions or interruptions.The aim is to get the Arduino to focus on reading ONLY... and once the reading phase is complete, it will report the signal data to the Serial monitor. So you will need to have the Serial monitor open when you press the remote control button.
The remote control signal will be made up of HIGH and LOW signals - which I will try to illustrate later in the tutorial. But for now, all you need to know is that the Signal will alternate between HIGH and LOW signals, and that they can be different lengths.
This sketch aims to identify how long each LOW and HIGH signal is (to make up the complete RF remote signal). I have chosen to capture 500 data points(or 250 LOW/HIGH combinations).You may wish to increase or decrease the dataSize variable to accomodate your specific RF signal. In my case, I only really needed 300 data points, because there was a "flat" signal for the last 200 data points (characterised by 200 repetitions of a LOW signal length of 0 and HIGH signal length of 255)
--------------------------------------------------
Receiver Fritzing Sketch

|

|

|
|

|
|
Results
After pressing the button on the RF remote, the data signal is printed to the Serial Monitor. You can copy the data to a spreadsheet program for review. This is an example of the signal produced after pushing the button on the remote for turning the fan/light on.
|
|
| The following code was produced from pushing the button responsible for turning the light off: | |
 |
|
| The code sequence above may seem a bit random until you start graphing it. I grabbed the LOW column - and produced the following chart:
|
|

|
|
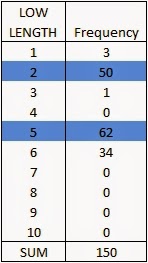
| The chart above is a bit messy - mainly because the timing is slightly out... in that sometimes it can squeeze an extra read from a particular signal. But what is important to note here is that you can differentiate a LONG signal from a SHORT signal. I have drawn a couple of red dotted lines where I believe most of the readings tend to sit. I then used a formula in the spreadsheet to calibrate the readings and make them a bit more uniform. For example, if the length of the signal was greater than 4 analogReads, then I converted this to 6. If it was less than 4 analogReads, then I converted it to 2. I used a frequency table to help decide on the cutoff value of 4, and just decided to pick the two values (2 for short, and 6 for long) based on the frequency tables below. I could have chosen 5 as the LONG value, but there were more 6's overall. **The meaning of "frequency" in the following tables relate to the "number of times" a specific signal length is recorded. |
|
|

|
And this is the resulting chart: |
|

|
|
You will notice that the pattern is quite repetitive. I helped to identify the sections with vertical red lines (near the bottom of the chart). In other words, the signal produced by the remote is repeated 6 times. I then did the same for the HIGH signal column and combined the two to create the following chart: |
|

|
|
| You will notice that the HIGH signals also have a repetitive pattern, however have a Very long length at the end of each section. This is almost a break to separate each section. This is what a single section looks like zoomed in: |
|

|
|
SL = [Short LOW] signal. - or short blue bar SH = [Short HIGH] signal - or short yellow bar LL = [Long LOW] signal - or long blue bar LH = [Long HIGH] signal - or long yellow bar VLH = [Very long HIGH} signal - or very long yellow bar (~92 analogReads in length) You will notice that there are only about 6 different combinations of the signals mentioned above. We can use this to create a coding system as described below: |
|

|
|
| We can use this coding system to describe the signals. The charts below show the difference between turning the LIGHT ON and LIGHT OFF. |
|

|
|

|
|
| PLEASE NOTE: You may notice when you copy the signals from the Serial monitor that you get a series of (0,255) combinations. This is actually a timeout sequence - which generally occurs after the signal is complete. Here is an example of what I mean. |
|

|
|
This is the end of tutorial 2. In the next tutorial, we will use the code acquired from the remote to turn the FAN LIGHT on and off (using the 433 MHz RF transmitter).

Thanks for this tutorial.
ReplyDeleteit's easy to follow, good explanation,
i have managed to retrieve the code from a pir sensor.
please can you give a hint or better write a tutorial how to receive the code found in tutorial 2 to start a sub in the sketch?
thanks for this great work,
Jeroen,
Hi Jeroen,
DeleteCan you please explain what you mean by "Start a sub in the sketch" ??
If you want to know how to transmit the code you acquired in tutorial 2, then continue on to tutorial 3.
Please be aware that somewhere in tutorial 1&2 I have managed to get LOWs and HIGHs mixed up. Or maybe I haven't. Anyway - you will find that when you are transmitting the code, that you have to transmit them the other way around (LOWs become HIGHs and vice versa).
See how you go.
Hi Scott, thanks for your reaction,
Deletei have also read tutorial 3 where you send the code with the Arduino.
but that is not my question, i want to receive de code with the arduino!
i have a pir sensor sending 433Mhz codes.
as i say, i have found the code.
Now i want to receive and let the arduino make a sound or something like that..
i have no idea how to start arduino listen only to the found code ?
i hope my question is now better.
(sorry my english is not very good)
Hi Jeroen,
DeleteI think I understand your question. You want the Arduino to listen for a specific code, and then get it to do something else ONLY when it receives that code.
This kind of question is always best served within an Arduino forum - where multiple respondents can provide relevant info and code snippets etc, plus the flow of information is specific to your question.
Having said that - your best bet is to have a look at tutorial 4 - which will show you how to get the Arduino to listen for the signal. This signal will be stored within the array called storedData[].
You can then use a function to clean up the signal using "IF" statements. eg.
if(storedData[i]<4){
storedData[i]=2;
}
You will need to do this also for values above or equal to 4.
Once you have cleaned up the code, you may only be interested in the first 10 or first 1000 values..... And would have to find a way to match these values in the storedData[] array with the pre-defined code you speak of. I can't go through the details here - because it would almost be a whole tutorial in itself - but please post your question on the Arduino Forum - and feel free to come back a leave a link to your forum query in the comments.
Good Luck
Hi Scott,
DeleteThis. IS. Amazing.
Thank you for your tutorial a 1000 times...I've been busting my brain with the rcswitch library as I have 2 different remote socket sets and they work with different protocols and I was able to control one, but not the other set.
YOU made it work for me! Thank you again.
So i made it a bit simpler for me, but there is a lot of room for improvement, including the scanner that would display a code to use, perhaps even with calculated timeDelay.
What I did was to use M$ Excel for code calculation, where I used the combination table, upgraded it according to my previously non-working socket (added High medium low) set and used it to calculate combinations.
I must point out, that the pairs (HI,LO) in your sketch are correct, but not also in the table, as you already mentioned. I figured out from received timeouts, that pair 0,255 should be 0 for HI and 255 for LO as it should be "silent" for a while.
So at this point I have 3+4 sockets, I can control with your code fragments, but it also lets me believe we could replicate almost any "as simple as these" control signal...I still have a wireless doorbell to try with.
As you already assumed, there should be different timeDelay lengths as in my case one is 115 and the other is 150 (middle values).
Keep up the good work and keep in touch.
Best regards,
Miroslav J. Perec (mirojp)
Thanks for the feedback Miroslav !!
DeleteI know I have somehow managed to reverse HIGHs and LOWs somewhere in my investigation process, and may need to go back and revisit where I have gone wrong...
Tutorial 4 is where I wanted to end up, whereas Tutorial 1-3 just show how I got there.
I wanted a quick way to record the signals and play them back without the need of Excel or a computer... and I managed to do this is in tutorial 4.
Glad to hear that it worked for you !!
Here is the link for tutorial 4:
Deletehttp://arduinobasics.blogspot.com/2014/07/433-mhz-rf-module-with-arduino-tutorial_30.html
can i know the price of this module
DeleteThe most up to date prices can be located by clicking on the relevant part within the "Parts Required" section of the tutorial.
DeleteHi Scott,
ReplyDeletegreat tutorial — thank you for the work. I'm trying to read a weather station's signal (and ultimately decode it), and I'll give this method a go.
So far I've often seen the suggestion to hook up the receiver to your computer's Mic In and record the signal with Audacity, and then simply analyze the waveform visually. The audio ADC's sample rate is high enough to produce a very detailed graph.
Anyway, I'm thinking of increasing the Arduino's analogread speed to improve the resolution. (In the hope of getting the best of both worlds.) Is your code available under an open license? I'd throw the result on Github (assuming I produce something sensible).
Tom
Hi Tom,
DeleteWhen I started this project, I did not know if it was going to work or not. When it did work, I did a little happy dance. Not sure if it works for anyone else.
Providing that your project is legal, I don't mind how you use my code.
I would be interested to hear how your project turns out, and would be happy with just a reference link back to this blog somewhere in your code or Github.
Hi, I found this tutorial and it's great job!
ReplyDeleteI've got a question:
how set the receiver to work on 433mhz, because now I receive a lot of noise, and don't know how can I receive clear signal?
Jakub
The receiver is already set to work at 433mhz. I found that using 3V instead of 5V worked better for me as it reduced the range of the receiver. The greater the range, then the more likely you are to receive stray/interfering signals from other sources. You could use something to boost the signal of the transmitter to penetrate through the noise. However, you would need to seek advice to make sure that this is lawful in your country. I used trial an error.
DeleteThe other alternative is use a different frequency (e.g.315mhz) - once again you will need to check that this (or any) frequency is acceptable in your country.
I was able to work without an antenna without any real issues.
Thank You, yesterday I finally read the code using Your program above. I've set the receiver to 433mHz using a screw on the receiver =D
DeleteAbsolutely awesome set of tutorials Scott.
ReplyDeleteI now have a beautiful Excel graph for one of my remote control signals. I have tweaked the settings in your sketch that transmits the signal but no joy. With my DVB-T system I now see virtually identical data from the signal from the remote control as I do from the Arduino but no response from the RF device.
It is a fairly basic RF socket and I have all the code details but I wanted to test your system before I went on to a more complex device. I have reduced the 10 microseconds down to 3 so there are several attempts within the zone I know I need to work at.
The graph (for off signal) and the comparison between remote signal and arduino signal (for on signal) can be seen at http://www.raspberrypi.org/forums/viewtopic.php?f=37&t=96807
Any ideas why the RF socket is not activating with your excellent code?
See tutorial 4 for my response to your question there
DeleteI think you are based in Australia Scott so I thought I would do further tests whilst you sleep with the more 'difficult' RF device I have. Followed your procedure and retained my tweaks in the sketch and it worked FIRST time.
ReplyDeleteStrange thing is with yesterdays tweaks for the 'easy' RF device the signals reported from DVB-T system for todays 'difficult' device show quite different readings (between actual remote and Arduino signal). Yet the Arduino controls the device just fine.
So I changed most of the sketch back to your original settings and the Arduino continues to control the device. As you have said in your tutorials there is quite a bit of flexibility in what is an acceptable signal for the RF devices.
I have 2 of the 'difficult' RF devices, which I will now rename as type 2 and they 'work' as opposed to the 'easy' RF devices which I would have expected to work as type 1, but don't work.
Type 2 devices have DIP switches and the 2 units I have are set to different codes. The working Arduino sketch will only activate 1 of the devices even when I send the revised code to the unit. The revised code being worked out as I know the binary sequence to send and DVB-T confirms it is sent correctly.
I have just changed the DIP switches on the none working type 2 device to match those of the working type 2 device. Arduino now controls both units. I did this just to check that one unit didn't have a different tolerance to the other.
So there is something I (or the Arduino) doesn't quite understand. Why will type 1 units not work even though the signals seem to match very well and why will type 2 units not work when set to a different code?
See tutorial 4 for my response to your question there
DeleteWhat about using interrupt instead of polling for signal change? I think this post (http://forum.arduino.cc/index.php?topic=129201.0) does exactly this.
ReplyDeleteWould you get a better measurement?
Hi Filippo,
ReplyDeleteBetter measurement ? Not sure.
Feel free to give it a go and let me know.
The method used above worked fine for me, so I had no reason to look any further.
Hi Scott
ReplyDeleteAm i still able to use the system if i have 5 meters to communicate?
Thx.
Hi emre - if you are talking about communicating between Arduinos, then this is not the right tutorial. If you are talking about using this to communicate with a fan/light receiver over a distance of 5m, then yes - I was able to send signals to the light/fan from a distance of 5m. Performance may vary depending on your module, the power being supplied, other interfering devices etc etc
DeleteThanks scott, it's a very good blog
ReplyDeleteplease witch spreadsheet software you need .
thnks
Hi Gogo,
DeleteThank you for the positive feedback.
I used Microsoft Excel, but you could get away with any other comparable spreadsheet program.
Hi Scott,
ReplyDeletecan you help me to calibrate sinal what formula you use to do that
thanks
Hi Gogo,
DeleteIf you are talking about the Frequency table in the picture above, you need to enter an array formula...
Step1 :Create the left side column (by choosing numbers that match your data),
Step 2: Highlight the cells in the column to the right, and enter this formula at the top
=FREQUENCY(data_array, bins_array) CTRL-Enter
Where
data_array is your RF data
bins_array is the column to the left (from Step1)
See an example in YouTube
Hi Scott!
DeleteI think i need you to explain the Excel a little bit more, maybe a video?
I dont get it, i have the value.
I dont get Step 1, and how do you clean up?
Sam.
Hi eShrek,
DeleteOk so you have the signal, and you have copied and pasted into Excel.
Just plot the values (using a bar chart), for the Low column. It should look something like this , however it will not have the red lines.... I just put them there so that you could see that the majority of points on that graph tend to sit at those two values. What you are trying to do is differentiate a LONG signal from a SHORT signal. So in my example, you can see that a long signal is around 5, and a short signal is around 2.
Now do the same for the HIGH column.
In my case, the HIGH column had 3 places of interest. It had a SHORT signal, a LONG signal and a VERY LONG signal. The short signal was roughly around 3, the long signal was around 6, but there was also a somewhat repetitive very long signal that was about 92 in length.
So this is tricky... on the LOW side the short length is 2, and on the HIGH side the short length is 3.
Also on the LOW side, the long length is 5, but on the HIGH side the long length is 6.
In reality, the length may be somewhere between these two values, but we want to make short and long lengths consistent for each column... which is what I mean by "calibrate"... so I decided to draw a line in the sand and call a short length a value of 2, and long length a value of 6.
You could tell that any value less than 4 was a short length. And any value greater than 4 was a long length. This was true for both columns. So for any value that was less than 4, I CHANGED the number to a 2, and for any value greater than 4 I CHANGED to a 6.
DeleteSo when I plot the LOW column it should now look like this .
On the HIGH column, I just had to be a little bit more careful, because remember, I did have those repetitive VERY LONG lengths to take into consideration. So for the HIGH column, any value that was greater than 50, I changed to 92. Once again I had to draw a line in the sand to keep the values consistent.
If you were to now plot both columns on the same chart, you should see something like this.
But obviously, that is a bit hard to see... so maybe just plot the first chunk of data, before it repeats itself. It should look like this.
You can see from that picture, that I started to label it with things like SL and SH, LL and LH. I just used a naming convention to identify whether it was a SHORT LOW signal (SL), or a LONG LOW signal (LL), and did the same for a SHORT HIGH signal (SH) and LONG HIGH signal (LH).
DeleteSo when you receive an RF signal, it will ALTERNATE between LOW and HIGH. But it does so for different durations... eg. It may stay LOW for 2 beats, and then jump HIGH for 6 beats, then back LOW for 2 beats and then back HIGH for 6 beats etc etc.... and we have just charted that pattern.
The signal always alternates between LOW and HIGH, and will stay low or high for a SHORT, LONG or VERY LONG time.
Now you could just program that pattern as is, but I have taken it one step further.
I have just created a specific CODE for each LOW-HIGH pair (eg. SL + SH = 1).
So when the signal is LOW for a SHORT amount of time (SL), and then switches to HIGH for a SHORT amount of time (SH).... this pair is equal to CODE (1)...as per my table here.
You can create a code for each of the other pairs that you are likely to encounter. Thankfully, there are only 6 combinations. But you may have more.
Once you create a code table, you can label your chart like this, so that you can create your SIGNAL CODE which may look something like this.
Alright. I think I got it!
DeleteHow do you change the values, are there any simple way? Not familiar with spreedsheets.
Anyway, thank you and you have very nice blogg. Will be fun to follow you! :)
Create Two new columns for the new data - one new column for the calibrated LOW and one for the calibrated HIGH.
DeleteLet us assume that the original LOW data is in Column A and starts at Row2 (i.e. A2).
And the original high data starts in B2.
The New calibrated LOW data will exist in Column C, and new calibrated HIGH data in Column D
So in cell C2 - you would write this formula:
=IF(A2>50,92,IF(A2>4,6,2))
This is known as a nested IF statement.
And you can read it like this:
"If Cell A2 is greater than 50, change the value to 92, if not then check to see if Cell A2 is greater than 4. If it is greater than 4 change the value to 6, otherwise change it to 2"
In Cell D2 you would write this formula:
=IF(B2>50,92,IF(B2>4,6,2))
Notice that it is essentially the same, but we are checking the cell B2 instead of A2.
Once you enter the formula, you can either copy and paste it down to the bottom of the column or use this short-cut.
1. Enter the formula into Cell C2: =IF(A2>50,92,IF(A2>4,6,2)) Press Enter
2. Select cell C2
3. Press: Ctrl+Shift+End Press these 3 buttons all at the same time
(this will select the column)
4. Press: Ctrl+D to copy the formula down that column.
You can repeat that process in column D, but use the correct formula as described.
==================================
Thank you for your feedback - feel free to share this blog post on social media.
You can follow me on Google+, Twitter, Instagram (and of course you can follow this blog). I am also on Pinterest and Tumbler - but not very active.
This is what i get:
Deletehttp://s10.postimg.org/5qkgto1op/what.png
Im not sure if that will be simple to decode...
Hi sShrek,
DeleteI am not sure what formula you were using, but it doesn't look right.
What is the LOW1 column ?
Why does it change from 100 down to 99,98,97.... ?
Looking at your signal - you can see that it goes
HIGH for 82 beats,
LOW for 59 beats,
HIGH for 255 beats (which is the maximum signal length)
LOW for 0 beats
HIGH for 114 beats
etc etc
The fact that you are getting many LOWs at 0 beats just after a HIGH of 255 beats, means that you need to adjust this line in the Arduino code.
int maxSignalLength = 255; //Set the maximum length of the signal
You will need to set it to something like 400.
And then try to receive the signal again.
Post your results within the ArduinoBasics forum - and I will help you from there.
first of all thanks For your valuable information you put.
ReplyDeletecan you upload the code in which it compare the the remote code with the one i store and if it true turn on led or any output and if is not discard it ?
Hello Scott C,
ReplyDeleteI just started this Arduino thingy and im not very good in it. First of all I would like to say that your videos are very good made and your blog is very interessting to watch.
Sadly I realy do not understand when you bring your datas from the serial monitor to the (Excel) sheet its one long line with something like that ...
2,42
1,8
2,8
7,2
2,8
1,8
7,2
2,8
1,8
2,8
1,8
7,3
7,2
...
it looks the same on my side. How do you seperate them into High and Low? Because i only have this one line with lots of numbers but not a second one. Hope you can help me because im kind of fustrated to bring my 433mhz device to work.
Hi Vin,
DeleteThank you for your feedback.
You have two numbers per row, separated by a comma.
You can use Excel's "text to columns" feature to split them into two columns of data. Alternatively, you could paste the data into a notepad/wordpad document and save it with a .csv extension.
And then import that file into excel... you could do it either way.
Hey Scott,
Deletethanks for that information. Now i had the next problem. I made here the Excel sheet
https://drive.google.com/folderview?id=0B66G7sV8o5BjMUc3WGw5eVRIN00&usp=sharing
its in xls and xlsx and when you open it and cant see values change to the sheet two there i made the calculations with english formulation.
Anyway i tried the code i got from it and it doesnt work. I checked the datas you put in the programm and saw there a value VLL but you wrote in this tutorial VHL so i was big confused.
I hope againe you can help me because i plan a project to control 433mhz switches with the universal remote control of a tv.The IR part works at the moment i just need to figure out how i can manage to get the code from the 433mhz transmitter.
Thanks a lot Vin
Hi Vin,
DeleteI know at some point in the process I got the HIGHs and the LOWs mixed up. I am not sure at which point of the process. So perhaps try sending LOWs as HIGHs and HIGHs as LOWs and see if that works for you.
I can tell from your spreadsheet that you are receiving a decent signal. You can make up your own coding system if you want to, or just play back what you received (see tutorial 4). I also noticed that you calibrated the long signals to a value of 6. I don't think this is right for your project... try pick a value that is close to what you are actually getting. For short signals you seem to be getting a value of 1 or 2 (so choosing a value of 2 should be fine).. For long signals you are getting values of 7 when it is a LOW, and 8 when it is a HIGH... you may need to incorporate this into your code somehow.
Your very long value of 42 is likely to be a spacer between the signals - which is why I think that column should be LOW values and not HIGH values - sorry I know I have muddled this up.. but I cannot pinpoint where my muddle starts.
There are a few examples of the process within the ArduinoBasics Forum. And I would say that if you cannot get it to work after this reply - then to post further queries related to this topic within the forum:
http://arduinobasics-forum.1116184.n5.nabble.com/Quick-questions-about-ArduinoBasics-projects-f3.html.. And we can work through this together.
I apologize for the confusion.
Vin,
ReplyDeleteHave you worked through tutorials 3 and 4?
Hello Anonymous,
ReplyDeletei tried both of them and both didnt work on my devices. Still dont know how to do it.
Vin,
ReplyDeleteWe have cracked some fairly complex RF codes with scott's stuff so it does work. As Scott suggests post on his forum where you are up to and I'm sure we can get you up and running. Sometimes you need to tweak the data a bit. We were getting lows and highs mainly as 1's and 7's but we new from other posts on the internet that the high was 3 X the low. When we changed 1's and 7's to 2's and 6's it all worked perfectly.
Hello
ReplyDeleteis it possible to see the signalstrengh between the transmitter and the receiver on a display?
for example to detect the transmitter behind a wall?
Thanks Alex
This comment has been removed by a blog administrator.
ReplyDeleteYou are not receiving a signal.
DeleteI don't think you really needed to paste the whole output into the comments... and if you really need to - then perhaps move this discussion to the ArduinoBasics forum (link in the tab at top of page).
hi , i can never get a patten on the low signal, does this matter? Im very new to arduino!
ReplyDeleteHi Chris,
DeleteWhen you say you are not getting a pattern on the low signal, do you mean that the signal pattern keeps changing every time you record it ? Are you getting any common sections between reads... for example
Read 1: SL, SL, LL, LL, SL, LL, SL, LL
Read 2: SL, LL, LL, SL, LL, SL, LL
Read 3: LL, SL, SL, LL, LL, SL, LL, SL, SL
While it seems that each read is different, you will notice that they are similar. Read 2 is the same as Read 1 IF you remove the first SL from Read 1. Read 3 is the same as Read 1 IF you add a LL to the beginning of Read 1... so when you say you can never get a pattern on the low signal - you have to be a bit more specific about what you mean.
What happens on the HIGH signal side ?
Can you differentiate between a long signal and a short signal for either the HIGH or LOW side?
hi thanks for the quick reply, the signal looks the same ( bunch of 4 and 5's),but it doesn't appear to be any precise pattern. Also I should be more clear on high , low, short, long! On the high's I get a reputation around every 67, an exact copy of what was before. I was hoping the low's would also repeat around 67. It does appear that , the low's do "want" to follow a pattern , i.e a short length of short then a short length of long repeating, but no where near as precise as the high's, which is identical after 67 .I plotted it in excel, and straight away it appears to have no pattern. I understand there would be a few unusual readings but as I say on the low's all I get are 4 and 5's , nothing huge.
ReplyDeletecheers
Hi Chris,
DeleteWhat values are you getting for your short highs and your long highs?
It might just be that all of your LOWs are the same. I don't think that 4 and 5 is "different enough" for you to be able to differentiate them.. so if it were me, I would just choose the most common value, and change all LOWs to that number. And then proceed with the tutorial... If your short HIGHs have a length of 4 or 5 then I would choose to be consistent and call these LOWs a "short low" or SL.
I hope that made sense.
The high's , I was getting readings of 11,10,2 and 1. I tidied them up to 2 and 10 and it looks very tidy a definite symmetrical pattern with a very high start of 97 like your picture above. As I say the lows obviously has a long and a short , and a very scruffy pattern , but certainly no ware near symmetrical. The highs repeated at 67 , there is certainly no repeat for the lows at 67! i will try what you suggest tonight thank you
ReplyDeleteDo you have skecth and cooding rf433mhz with pushbutton and 2 arduino uno or projectboard without using remote mercator ceilling fan/light?
ReplyDeleteHi Udin,
DeleteNo I don't - sorry.
Really educative post, so this is how remotes are done! Thanks for sharing!
ReplyDeleteit work , thanks
ReplyDeleteint lightON[]={2,4,4,4,4,2,4,2,4,4,4,2,2,2,2,4,2,4,2,4,4,4,2,2,6};
for(int j = 0; j<6; j++){
for(int i = 0; i<codeSize; i++){
switch(codeToTransmit[i]){
case 1: // SH + SL
highLength=3;
lowLength=3;
break;
case 2: // SH + LL
highLength=1;
lowLength=10;
break;
case 3: // SH + VLL
highLength=3;
lowLength=92;
break;
case 4: // LH + SL
highLength=10;
lowLength=1;
break;
case 5: // LH + LL
highLength=7;
lowLength=7;
break;
case 6: // LH + VLL
highLength=3;
lowLength=99;
break;
}
9,2
9,2
9,2
9,2
2,9
9,2
2,9
9,2
9,2
9,2
2,9
2,9
2,9
2,9
8,3
2,9
8,3
2,9
8,3
8,2
9,2
3,8
3,8
3,8
3,99
just got a little bit problem , the board voltage is 3v and i given input 5v from arduino to that rf board , and the problem is , the board will hang.....why?? i need to change the output voltage from 5v to 3v?
I don't know what board you have, but the one I have will operate at 5V without any issues. If you look at the link for the transmitter, you will see that the operating voltage is from 3-12V. And the XY-MK-5V Receiver operates at 5V.
DeleteSo no idea why your board is "hanging"??
Hello Scott, I need help, i received the code from controller but, i dont have idea to convert the received signal to code.
ReplyDeleteThe part repeat is
2 5
2 6
5 2
5 3
2 5
2 6
5 2
2 6
2 6
1 6
2 6
2 5
5 3
2 5
2 6
2 6
5 2
2 6
1 6
2 6
2 5
2 6
2 5
5 3
2 6
5 2
5 3
5 2
2 6
2 5
2 6
5 3
1 6
2 6
1 6
5 3
1 6
2 6
2 5
5 3
41 13
Any Formula to covert ,
Hi Victor,
DeleteIn your case, any time you see a 1, change it to a 2.
Am not sure about what you should do about all the 3s. Perhaps just leave them like that for now.
And any time you see a 5, convert that to a 6.
You do not necessarily have to convert them to a code if you don't want to... you could just have a couple of arrays that you use to replay the sequence by using a for-loop.
Have a look at my review of the EspoTek Labrador on my YouTube channel... In that review, I use the Labrador to intercept the signal of my RF remote... it might help you to visualise the signal that you are trying to reproduce.
Here is the link to the EspoTek Labrador review that I am talking about: click here for the review
Hi Scott,
ReplyDeleteMy name is Roberto. Thanks for sharing such a good inofrmation. My problem very simple. Regarding tutorial 2 I have several 433 MHz remotes but no information is detected in the serial monitor. I have changed bateries, arduino board, RF receiver....everything and don't know what more can I do. I would appreciate your help, any sugestion?
Thanks in advance
Have you tried tutorial 4 ?
DeleteSee if that one works.
Also - how did you go with tutorial #1.
This will help test your modules.
Another trick is to make sure you press the remote button right next to the receiver module. And some people also report that they have to press the remote button around the same time as resetting the Arduino (attached to the receiver).
DeleteTry pressing the button before, at the same time, slightly after, and shortly after pressing the reset button.
Once the LED lights up, it has started to receive a signal. So pay attention to the LED, and make sure that interference is not affecting your ability to receive signals.
Hi Scott,
ReplyDeleteMy name is Moshe and My problem is, after I was able to receive and transmit, everything works fine until I press on the original remote control again, and then I see the code is different each press on the original remote control.
I do not understand how the original receiver can know what is the next code that transmit from the original remote control, even tried to pull the battery from the remote control and then returned, trying to figure if there any master code.
Please if you can explain it drives me crazy.
Best regards,
Moshe
Some systems have a rolling code.
Deletehttps://en.wikipedia.org/wiki/Rolling_code
I think, I didnt understand this :(
ReplyDelete1st of all, why we connect receiver to A0 ?? Shouldnt we have a digital out from receiver ?
It doesn't matter. The analog pin essentially shows you the voltage of a HIGH reading. You could connect it to a digital pin if you want.
DeleteWe are just counting how long it stays high and how long it stays low. There are many ways you could do this. And yes - if I chose to do this project again (knowing what I know now), I would probably do it differently. But I think it is important to leave it the way it is, so that people can see an alternative way of doing things and expand their knowledge.
Voltage = (Analog reading /1023) * 5
DeleteOk, I now understand the logic. Thanks for your time and replying all comments.
DeleteBut I still have difficulties with decoding signals. Here is what I do;
1-I isolated the receiver with alum foil from electromagnetic noise.
2-I analogread the output of the receiver
On serial monitor the signal is always bouncing between 0 - 700. Is it normal? According to my logic, without any signal serial monitor should not move that much.
After frying a couple of receivers I finally got part 1 complete.
ReplyDeleteI would like to use this in a practical example but to do this I need to have the transmitter working off 433.92Mhz. I have a transmitter that can do this. But before I can transmit anything I need to learn what I need to send if you catch my drift.
How easy is it to convert one of these modules to receive 433.92Mhz transmissions? Do I just need to swap out the resonator?
Hi Chris,
Delete433Mhz and 433.92Mhz should be the same ?
See this thread:
http://forum.arduino.cc/index.php?topic=285124.0
Aha.
ReplyDeleteSo thats why I was able to get a >700 reading off A0 when transmitting.
Thanks Scott, once again.
I find the Short and Long difficult to get my head around. Would:
10100110
Translate to:
SH,SL,SH,LL,LH,SL ? For example
Yes - that is essentially correct.
DeleteThat assumes that the transmitted rate is exactly the same as the read rate.
Let's say you read the state of the pin, but can now do it twice as fast. The number would appear as:
1100110000111100
--__--____----__
SH,SL,SH,LL,LH,SL
I hope that made sense, but yes you are on the right track.
I was one step from quitting my project, and I saw your tutorial.
ReplyDeleteIt gave me a great help.
Thanks
Hi Yannis,
DeleteI am very glad that it helped you.
Feel free to share this tutorial on your social channels so that others in the same boat as you can benefit as well.
This comment has been removed by a blog administrator.
DeleteHi Santiago,
DeleteI do think you are experiencing interference, but there is a hint of a repetitive pattern in your results. I have deleted your query, because the results you posted take up about 10 pages of comment space... but here is what I would do.
Firstly, get the transmitter and receiver as close together as possible.
Record the results multiple times and look for patterns between the results... they may be offset, but charting the results helps alot.
Try pressing the record button just before you press the transmit button, and it doesn't hurt to play around with the timing of this button press. Try it early, try it late, try it at the same time, but keep plotting the results and look for patterns. Eventually you will get an idea of what is Normal and what is interference. You will also get an idea of when you need to press the button in order to record the entire signal. You may also need to modify the sketch to capture a longer duration in order to capture the entire signal.
Hi Scott,
ReplyDeleteI'll work on that.
Thanks for your help.
Hi Scott,
ReplyDeleteFirst, I just want to thank you for a good tutorial!
I just have a small question regarding a project I’m working with. I’m trying to decode a remote for a gate I have. I seem to get the correct values and I can see that there is a pattern. It looks like it repeats the signal 3 times but with one thing different. The first block ends with an “LL + VLH”, but the 2 other blocks end with “SL + VLH”. How should I handle this when I sending it in your opinion? Please see the link for more information: https://ufile.io/97do1
Best Regards
Tim
Hi Tim,
DeleteIf the 3 codes are consistent. Then just transmit the codes in the same way that you receive it.
Rather than try to send 3 separate signals, just transmit one signal that encapsulates (or contains) the 3 signals. Use the same timing/spacing as your captured pattern.
For example, when you received the signal. It may have had a pattern like xAxBxBx.
Where x may have been a specific time between signals A and B.
Rather than trying to write Arduino code to transmit x, and then transmit A, and then x again... etc etc.
Why not just transmit the single signal xAxBxBx.
You recorded the signal, just play it back.
You may want to look at tutorial 4. Which shows how to record and play back a signal without using excel.
Hi Scott, the instructions advise that if the LED does not blink while pressing the remote, this will not work for me. Here is what is happening for me:
ReplyDelete1. I have a 433Mhz receiver which I know for a fact is working because I was able to capture the RF signals using the in-line of my sound card and I can clearly see the short and long pulses
2. when I load the above sketch for the receiver onto the Uno board, the serial monitor display a number stating somewhere above 400 and it gradually reduces to 293-295. This is without pressing the remote buttons at all.
3. When I press the RC button, nothing happens, there is no change to the number displayed in the serial monitor
I am not sure how to interpret this. Could you elaborate on why the LED not blinking means I cannot use this tutorial? and can you suggest a way that I can get to use the Arduino board to read those RF signals?
Many thanks,
Gaetano.
Hi, my sketch start recording before I pressed one button on my remote :D why?
ReplyDeleteSame problem here :-(
DeleteReceiving stray signals / interference.
DeleteJust try multiple times, try to vary your timing.
If you don't succeed on the first attempt, attempt again.
Do it until it works.
It is not perfect.
Hi Scoot,
ReplyDeleteCan you please tell me why I am getting different codes for pressing the same button?
Can anyone please help me in making the graph, I am doing this for first time. my skype ID: uday.kumar2555
I am trying to hack RF codes using 4-5 ways. I want to be successful using this approach too. If anyone help me I will show lots of hack tricks in IOT
Might be a rolling code.
Delete